Visual Studio List Debugger Visualizer
I allways find inspecting list in the debugger pretty tedious and difficult, so I decided to change that :)
I made a Visual Studio debugger visualizer for List<T> or more precisly if inspected object implement IList, downside is that type T must have Serializable attribute, not anymore !! You can view any list members whether or not they are marked as Serializable.
Warning: Visual Studio List Debugger Visualizer does NOT work for .NET Core projects, and there will be no new version for VS 2022 and later, simple because Visual Studio 2022 has finally got such feature, there is a pretty decent IList visualizer in VS 2022 :)
I used Telerik RadGridView for displaying data because it's packed with nice features and I was done in no time, but downside is that visualizer dll is 4MB and sometimes can be slow to show. Another slick feature is that your visualizer will remember grid settings for every type separately, and there is a handy option to export visualized data to Excel.
Source available on github: https://github.com/antonio-bakula/ListDebuggerVisualizer
Visual Studio Marketplace: https://marketplace.visualstudio.com/items?itemName=AntonioBakula.vs2019-list-visualizer
Installation:
Simply copy visualizer dll to your Visual Studio Visualizers folder:
VS 2019
c:\Users\<username>\Documents\Visual Studio 2019\Visualizers
VS 2017
c:\Users\<username>\Documents\Visual Studio 2017\Visualizers
Download:
Usage:
Types that implement IList will get little magnifier icon in Debugger Locals / Variables Watch, like this:
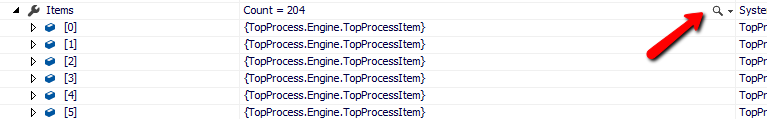
Click on magnifier icon and if IList members are marked as Serializable,
their contents will be shown in grid, like on screenshots below.
For older Visual Studio versions look here.
Screenshots
debugging the list that contains model object for Top Process with information about active windows processes:
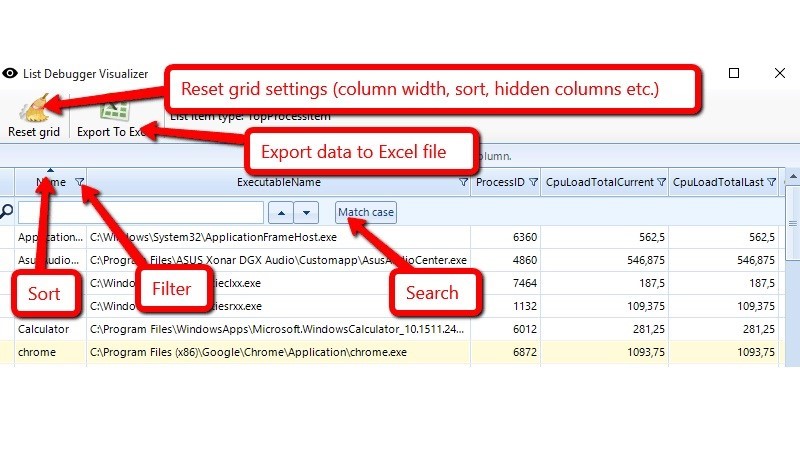 Use grid column commands to sort and filter data, and toolbar commands to export data to excel and reset grid settings.
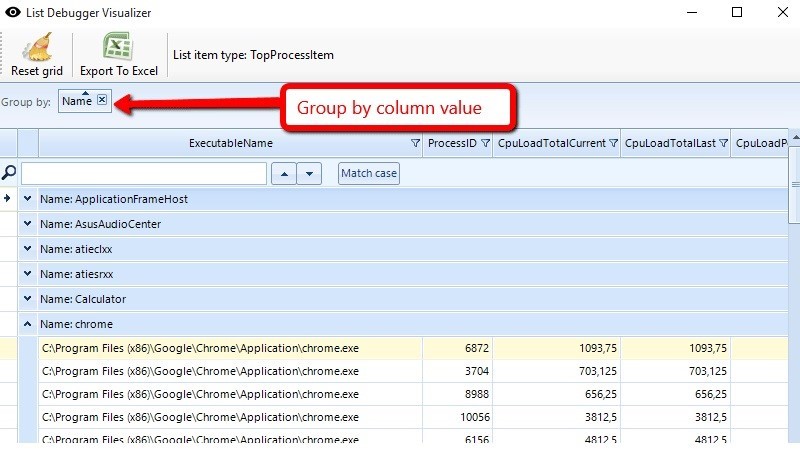 Drag a column header to group data by that column.
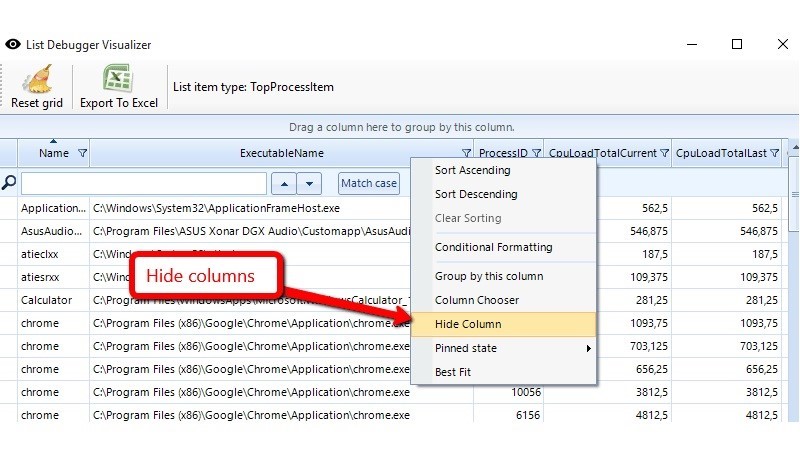 Right click on column header brings context menu with more options.